Detection of out of trends (OOT) in stability study. Determination of OOT limits from historical data, batch pooling evaluation, identification of worst batches (“worst” slopes) and tolerance interval of regression

Detection of out of trends (OOT) at release and in stability study. Determination of OOT limits from historical data, batch pooling evaluation, identification of worst batches (“worst” slopes) and tolerance interval of regression
Fill in the contextual information about your study and its purpose.
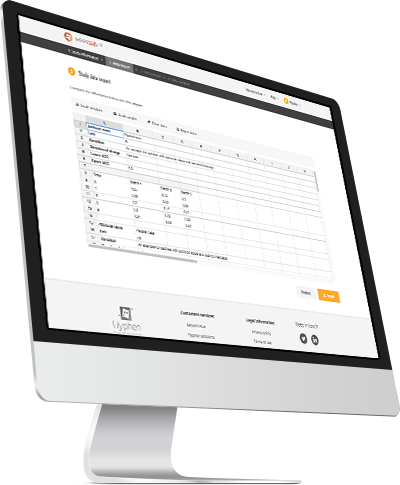
Import one or more parameters with the input assistant or by simply copying / pasting from your usual spreadsheet.
Load an example of a dataset directly into the application and quickly get a preview of the results.
Fill in the contextual information about your study and its purpose.
Import one or more parameters with the input assistant or by simply copying / pasting from your usual spreadsheet.
Load an example of a dataset directly into the application and quickly get a preview of the results.
Visualize the evolution of your process over the study period.
Calculate / review control limits to prevent and correct drift and ensure product quality.
Visualize the evolution of your process over the study period.
Calculate / review control limits to prevent and correct drift and ensure product quality.
Visualize Historical and New batches.
Identify the worst batches.
Evaluate the performance of your process to ensure the quality of your products in fine.
Visualize Historical and New batches.
Identify the worst batches.
Evaluate the performance of your process to ensure the quality of your products in fine.
Publish the full study report in compliance with the regulatory requirements of the Product Quality Review and built according to eCTD guidelines to facilitate the sharing of results.
The application is fully validated and meets 21-CFR-part 11 recommendations.
The application is accessible without installation and at any time on our secure platform.

To try our solution dooter, please complete this form. We will create your free account, valid during 2 months.
Please note it may take up to 3 working days to receive your account information.
